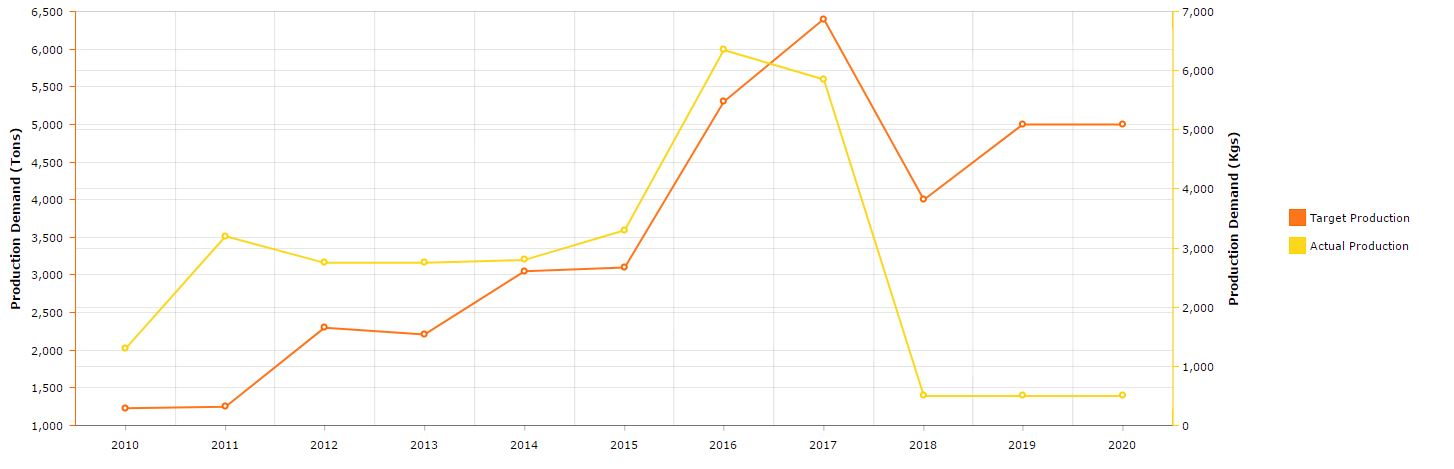
I am trying to create chart of columns with 3 graphs. I want to 2 of the graphs to use a left value axis and the 3rd graph to use a right value axis as the range of values of each of these graphs are quite different. How do I configure such a chart ?
CK
gorelov
October 19, 2016, 11:07am
#2
Hello,
For your case, you need to add three value axes and bind each graph with appropriate axis by id. To illustrate this, I’ve attached a sample project.
Below source code for screen descriptor and controller:
<?xml version="1.0" encoding="UTF-8" standalone="no"?>
<window xmlns="http://schemas.haulmont.com/cuba/window.xsd"
        caption="msg://caption"
        class="com.company.demo.web.ui.chart.ChartDemo"
        messagesPack="com.company.demo.web.ui.chart"
        xmlns:chart="http://schemas.haulmont.com/charts/charts.xsd">
    <dsContext>
        <collectionDatasource id="statisticsDs"
                              class="com.company.demo.entity.Statistic"
                              refreshMode="NEVER"/>
    </dsContext>
    <dialogMode height="600"
                width="800"></dialogMode>
    <layout>
        <chart:serialChart id="chart"
                           categoryField="date"
                           datasource="statisticsDs"
                           depth3D="30"
                           angle="30"
                           height="100%"
                           theme="LIGHT"
                           width="100%">
            <chart:valueAxes>
                <chart:axis id="v1"
                            axisColor="#FF6600"
                            axisThickness="2"
                            axisAlpha="1"
                            position="LEFT"></chart:axis>
                <chart:axis id="v2"
                            axisColor="#FCD202"
                            axisThickness="2"
                            axisAlpha="1"
                            position="RIGHT"></chart:axis>
                <chart:axis id="v3"
                            axisColor="#B0DE09"
                            axisThickness="2"
                            gridAlpha="0"
                            offset="50"
                            axisAlpha="1"
                            position="LEFT"></chart:axis>
            </chart:valueAxes>
            <chart:graphs>
                <chart:graph valueAxis="v1"
                             lineColor="#FF6600"
                             bulletBorderThickness="1"
                             hideBulletsCount="30"
                             title="Red Line"
                             valueField="visits"
                             type="COLUMN"
                             fillAlphas="1"></chart:graph>
                <chart:graph valueAxis="v2"
                             lineColor="#FCD202"
                             bulletBorderThickness="1"
                             hideBulletsCount="30"
                             title="Yellow Line"
                             valueField="hits"
                             type="COLUMN"
                             fillAlphas="1"></chart:graph>
                <chart:graph valueAxis="v3"
                             lineColor="#B0DE09"
                             bulletBorderThickness="1"
                             hideBulletsCount="30"
                             title="Green Line"
                             valueField="views"
                             type="COLUMN"
                             fillAlphas="1"></chart:graph>
            </chart:graphs>
            <chart:legend useGraphSettings="true"></chart:legend>
            <chart:chartCursor cursorPosition="MOUSE"></chart:chartCursor>
            <chart:chartScrollbar></chart:chartScrollbar>
            <chart:categoryAxis axisColor="#DADADA"
                                minorGridEnabled="true"></chart:categoryAxis>
            <chart:export position="BOTTOM_RIGHT"></chart:export>
        </chart:serialChart>
    </layout>
</window>
ChartDemo.java
public class ChartDemo extends AbstractWindow {
    private static final int DAYS = 100;

    @Inject
    private Chart chart;
    @Inject
    private CollectionDatasource<Statistic, UUID> statisticsDs;
    @Inject
    private TimeSource timeSource;
    @Inject
    private Metadata metadata;

    @Override
    public void init(Map<String, Object> params) {

        Date firstDate = DateUtils.addDays(timeSource.currentTimestamp(), -DAYS);

        for (int i = 0; i < DAYS; i++) {
            Date date = DateUtils.addDays(firstDate, i);

            long visits = Math.round(Math.random() * 500) + 10 + i * 2;
            long hits = Math.round(Math.random() * 80) + 500 + i * 3;
            long views = Math.round(Math.random() * 6000) + i * 4;

            statisticsDs.includeItem(statistic(date, visits, hits, views));
        }

        chart.zoomToIndexes(statisticsDs.size() - 20, statisticsDs.size() - 1);
    }

    private Statistic statistic(Date date, long visits, long hits, long views) {
        Statistic statistic = metadata.create(Statistic.class);
        statistic.setDate(date);
        statistic.setVisits(visits);
        statistic.setHits(hits);
        statistic.setViews(views);
        return statistic;
    }
}
Regards,
MultipleValueAxesChartDemo.zip (28.5K)
1 Like
parmelim
February 8, 2017, 9:05pm
#3
Hello
Is it possible to add value axis to a chart programmatically?
Thanks, Pedro
gorelov
February 9, 2017, 7:52am
#4
Hello,
Please see this topic. I think it will be helpful.
Regards,
Gleb
Hi Gleb,
Multiple y axis is working but issue is,for on axis the line separator is 500 and for other 1000(means for one axis i have 10 coordinates and for other have 5 coordinates). How to fix this issue.
And also how to add dynamic colors for lines.
Please check the reference file.
Regards,
Mallik