I have code that implements dynamically adding graphs to a chart, similar to this:
[Dynamically add graph to charts - CUBA.Platform]
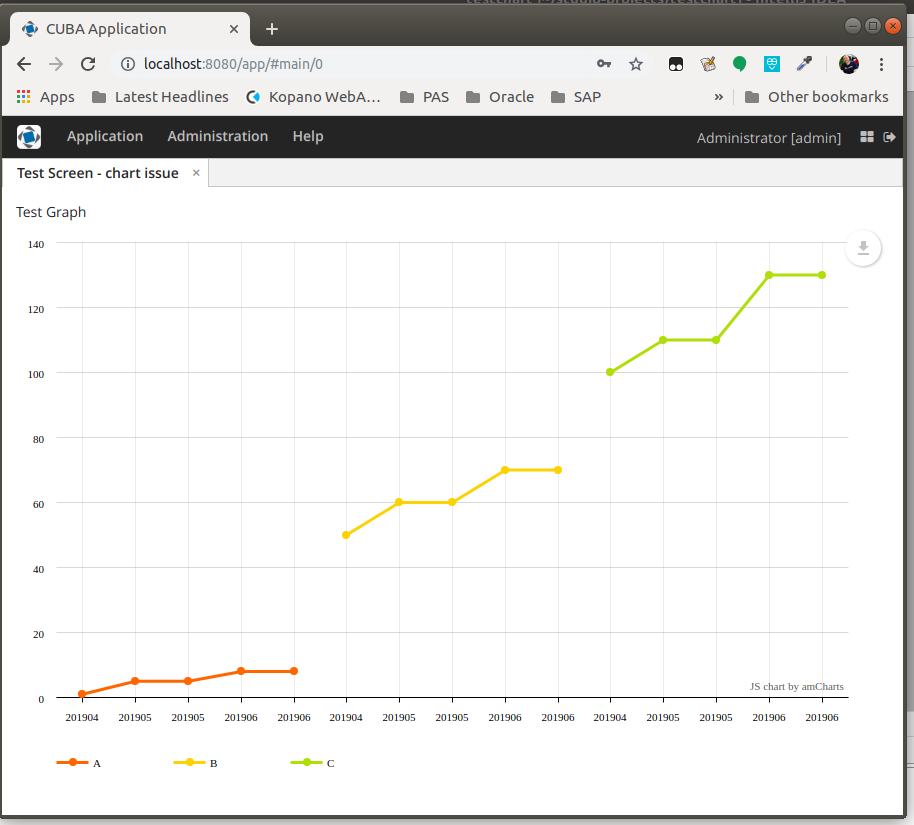
However, for some reason, the category axis is not lining up:
I can confirm that each of the points is using the exact same category values, but instead of the lines stacking on top of each other, they are left to right.
How do I get all the graphs to share ONE x (category) axis?
Here is the code:
ListDataProvider dataProvider = new ListDataProvider();
projInventoryByDate.setDataProvider(dataProvider);

String currProdcode = null;
Graph currentGraph = null;

for ( KeyValueEntity s: projInventoryDc.getItems()) {
    if (s.getValue("prodcode").equals(currProdcode)) {
        MapDataItem dataItem = new MapDataItem();
        dataItem.add("fmtDate", s.getValue("fmtDate"));
        dataItem.add(currProdcode + "Needed", s.getValue("inventoryNeeded");
        dataProvider.addItem(dataItem);
    } else {
        currProdcode = s.getValue("prodcode");
        currentGraph = new Graph()
                .setId(currProdcode)
                .setStackable(true)
                .setTitle(currProdcode)
                .setValueField(currProdcode + "Needed");
        projInventoryByDate.addGraphs(currentGraph);
    }
}
<chart:serialChart id="projInventoryByDate"
autoMarginOffset="20"
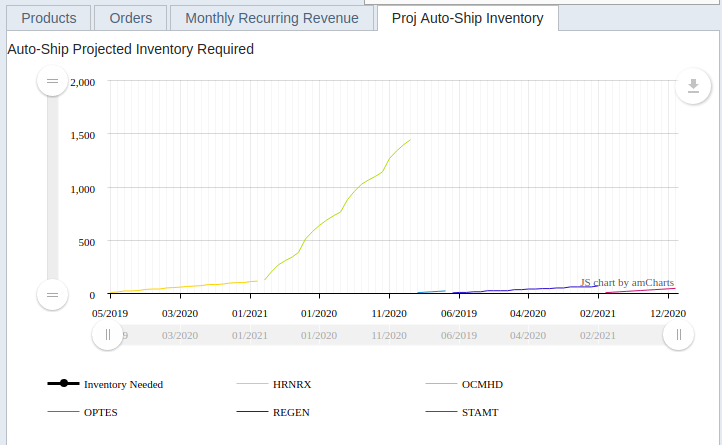
caption="Auto-Ship Projected Inventory Required"
categoryField="fmtDate"
creditsPosition="BOTTOM_RIGHT"
colspan="4"
height="100%"
marginLeft="40"
marginRight="40"
mouseWheelZoomEnabled="true"
width="100%" responsive="true">
<chart:valueAxes>
<chart:axis id="mrrBottleAxis"
axisColor="BLACK"
stackType="REGULAR"
axisAlpha="0"
ignoreAxisWidth="true"
position="LEFT"/>
</chart:valueAxes>
<chart:balloon borderThickness="1"
shadowAlpha="0"/>
<chart:graphs>
<chart:graph id="mrrInventory"
bullet="BUBBLE"
valueAxis="mrrBottleAxis"
balloonText="<span style='font-size:10px;'>Needed: [[value]] Bottles)</span>"
type="LINE"
title="Inventory Needed"
lineColor="BLACK"
lineThickness="3"
valueField="inventoryNeeded"/>
</chart:graphs>
<chart:categoryAxis dashLength="1"
minorGridEnabled="true"/>
<chart:chartScrollbar autoGridCount="true"
backgroundAlpha="0"
color="#AAAAAA"
graph="g1"
graphFillAlpha="0"
graphLineAlpha="0.5"
offset="30"
oppositeAxis="false"
scrollbarHeight="20"
selectedBackgroundAlpha="0.1"
selectedBackgroundColor="#888888"
selectedGraphFillAlpha="0"
selectedGraphLineAlpha="1"/>
<chart:chartCursor cursorAlpha="1"
cursorColor="#258cbb"
cursorPosition="MOUSE"
limitToGraph="g1"
pan="true"
valueLineAlpha="0.2"
valueLineBalloonEnabled="true"
valueLineEnabled="true"
valueZoomable="true"/>
<chart:valueScrollbar offset="50"
oppositeAxis="false"
scrollbarHeight="10"/>
<chart:legend useGraphSettings="true"/>
<chart:export/>
</chart:serialChart>