Serial Chart : Use different property on baloon text

Hi,

I have a query that returns three properties, name | code | count…see below:

<valueCollectionDatasource id="itemCountDs">
    <query>
        <![CDATA[select e.item.code as itemCode, e.item.name as itemName, count(e) as productCount from ppm$Products e where e.status = :custom$status group by e.item, e.item.name]]>
    </query>
    <properties>
        <property datatype="string"
                  name="itemCode"/>
        <property datatype="string"
                  name="itemName"/>
        <property datatype="int"
                  name="productCount"/>
    </properties>
</valueCollectionDatasource>

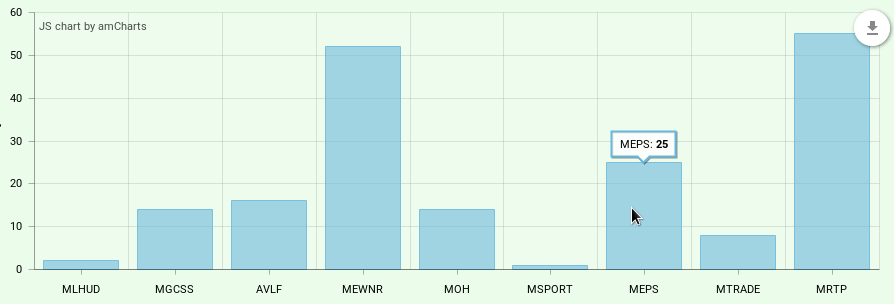
I want to use the item name on the balloon text and the item code on the axis, the name is a bit long so having it as the category axis will make the graph unreadable. Can anyone help?

See graph xml below:

<groupBox id="itemCountgroupBox"
          caption="Item Breakdown">
    <chart:serialChart id="itemSerialChart"
                       autoMargins="false"
                       categoryField="itemCode"
                       datasource="itemCountDs"
                       height="300px"
                       marginBottom="32"
                       marginLeft="55"
                       marginRight="18"
                       marginTop="10"
                       plotAreaFillAlphas="0.1"
                       responsive="true"
                       rotate="false"
                       startDuration="1"
                       width="100%">
        <chart:categoryAxis gridPosition="START"/>
        <chart:valueAxes>
            <chart:axis position="LEFT"
                        title="No. of Products"/>
        </chart:valueAxes>
        <chart:graphs>
            <chart:graph balloonText="[[category]]: &lt;strong&gt;[[value]]&lt;/strong&gt;"
                         fillAlphas="0.57"
                         lineAlpha="0.8"
                         type="COLUMN"
                         valueField="productCount"/>
        </chart:graphs>
        <chart:export/>
    </chart:serialChart>
</groupBox>

This is how the graph shows at the moment.
itemGraph

Thanks in advance.

Hi!

If you worry about long names in the CategoryAxis you can use labelRotation propety. It will rotate labels according to the angle.

<charts:categoryAxis labelRotation="45"/>

See exmaple in AmCharts demos.
Or you can use rotated chart like in the our Sampler and in the AmCharts demos. In this case, labels will not intersect and will have enough space.

Also, if you want to fetch more entity attributes from the data provider use additionalFields attribute. It provides additional fields which can be used the chart. For instance:

<charts:serialChart id="serialChart"
                    additionalFields="population"
                    categoryField="countryName"
                    dataContainer="countriesDc">
    <charts:graphs>
        <charts:graph type="COLUMN"
                      balloonText="Population: [[population]]"
                      valueField="income"/>
    </charts:graphs>
    ...
</charts:serialChart>

See documentation about additionalFields.

Hi Roman,

Many thanks.

I had tried rotation but the names are actually VEEEERY LONG so it wouldn’t have worked. The additionalFields is what I was misplacing, placing it inside the charts:graph instead of charts:serialChart section.

This has worked!

Again, thanks.

Regards…