Hi
Is there any example on how we can customize heatmap colour rules/conditions in CUBA (Pivot table?)
Hi,
In order to customize heatmap colors you need to define rendererOptions > heatmap > colorScaleGeneratorFunction - it’s a JavaScript function. Unfortunately, the original pivottablejs documentation doesn’t contains any details about colorScaleGenerator. So, after investigating the source code I found that this function accepts a list of values and returns a function that returns a color for a specific value. The default implementation looks as follows:
function(values) {
  var max, min;
  min = Math.min.apply(Math, values);
  max = Math.max.apply(Math, values);
  return function(x) {
    var nonRed;
    nonRed = 255 - Math.round(255 * (x - min) / (max - min));
    return "rgb(255," + nonRed + "," + nonRed + ")";
  };
}
and the same within pivot table configuration:
...
<chart:rendererOptions>
    <chart:heatmap>
        <chart:colorScaleGeneratorFunction>
            function(values) {
              var max, min;
              min = Math.min.apply(Math, values);
              max = Math.max.apply(Math, values);
              return function(x) {
                var nonRed;
                nonRed = 255 - Math.round(255 * (x - min) / (max - min));
                return "rgb(255," + nonRed + "," + nonRed + ")";
              };
            }
        </chart:colorScaleGeneratorFunction>
    </chart:heatmap>
</chart:rendererOptions>
...
Regards,
Gleb
2 Likes
Hi Gleb
Thank you so much for investigating the possible solution and I’m sorry being responding late (was away for some days for vacation…).
So how can we use this default implementation within CUBA application, any suggestion? A code snippet will really appreciated.
Hi,
Regards,
Gleb
Hi Gleb
How can I use this in the controller so that one can set conditional colour based on value range defined by user.
Hi,
You can just use Java API that reflects XML config (and vice versa)
@Inject
private PivotTable pivotTable;

@Subscribe
private void onInit(InitEvent event) {
    pivotTable.setRendererOptions(
            new RendererOptions().setHeatmap(
                    new HeatmapRendererOptions().setColorScaleGeneratorFunction(
                            new JsFunction("function(values) {" +
                                        "var max, min;" +
                                        "min = Math.min.apply(Math, values);" +
                                        "max = Math.max.apply(Math, values);" +
                                        "return function(x) {" +
                                            "var nonRed;" +
                                            "nonRed = 255 - Math.round(255 * (x - min) / (max - min));" +
                                            "return \"rgb(255,\" + nonRed + \",\" + nonRed + \")\";" +
                                        "};" +
                                    "}")
                    )
            )
    );
}
Hi Gleb
Thank you so much.
I used the following modified codes:
 pivotTable.setRendererOptions(
        new RendererOptions().setHeatmap(
            new HeatmapRendererOptions().setColorScaleGeneratorFunction(

                new JsFunction("function(values) {" +
                        "var max, min, max2, max3;" +
                        "min = 15000;" +
                         "max = 25000;" +
                        "return function(x) {" +
                        "var nonRed;" +
                        "nonRed = 228 - Math.round(228 * (x - min) / (max - min));" +
                         "return \"rgb(228,\" + nonRed + \",\" + nonRed + \")\";" +
                        "};" +
                        "}")
            )
        )
    );
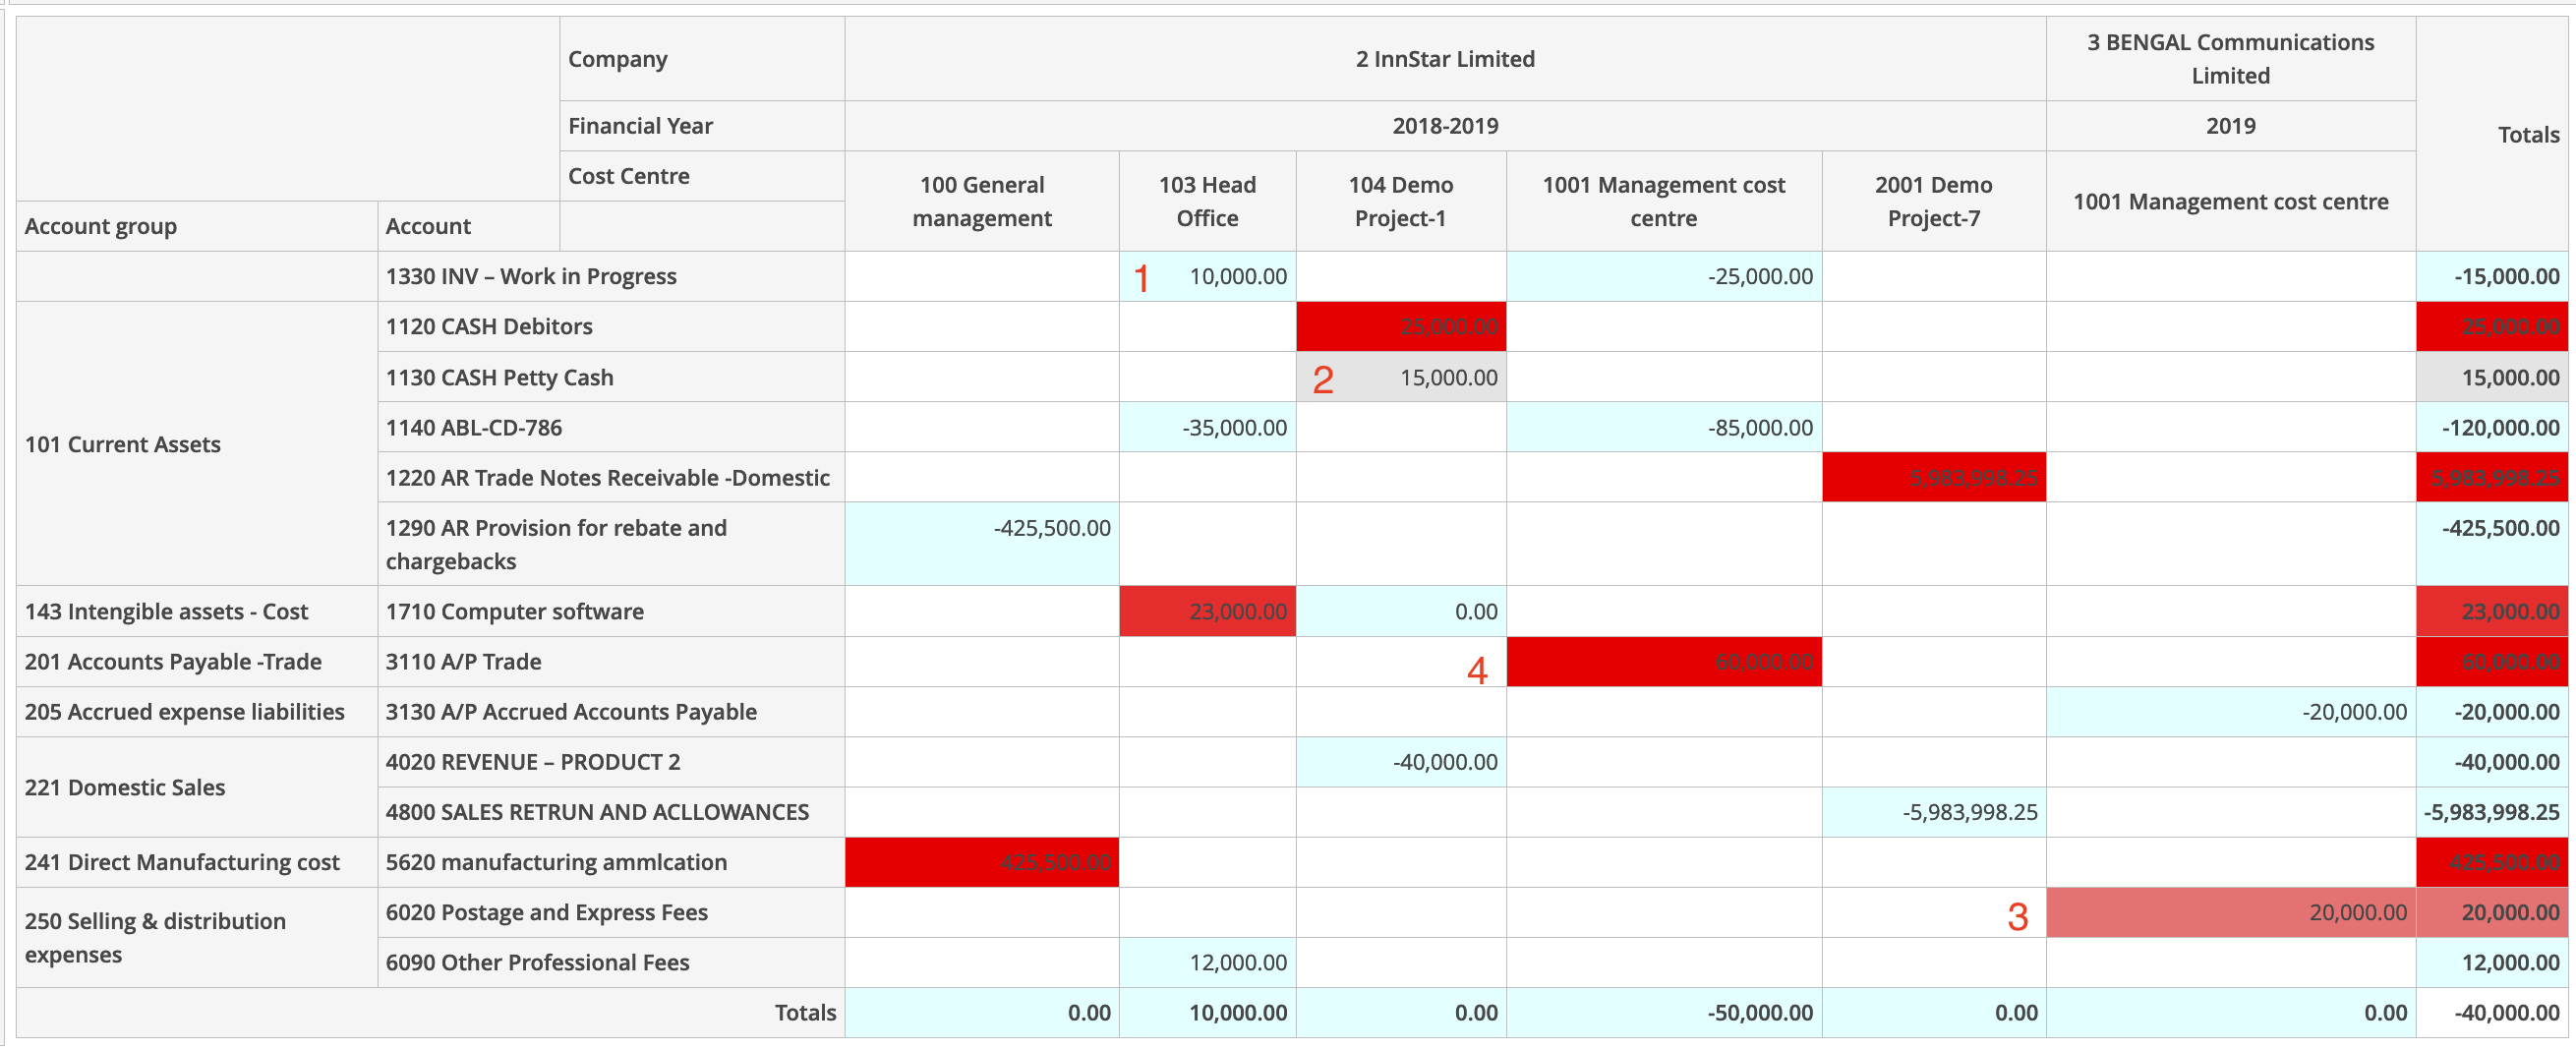
I get the following result which is not bad. As you see there are 4 different colour are used and I don’t have complete control of the colours used.
As I am looking for a bit more advanced implementation instead of hard-coded parameters, I’m not sure how the parameters from the data container can be used in the JS function. Therefore, now my next questions are:
-
How can we use the parameter value for multiple scales of value, for example, when the value is <0 or between 0 to 10000 or between 10001 to 50000 or >50000. The parameter values are to be obtained from a data container instead of hard-coded.
-
Colour for the cell-value to be defined based on the parameter conditions above.
Looking forward to your help.