Hello,
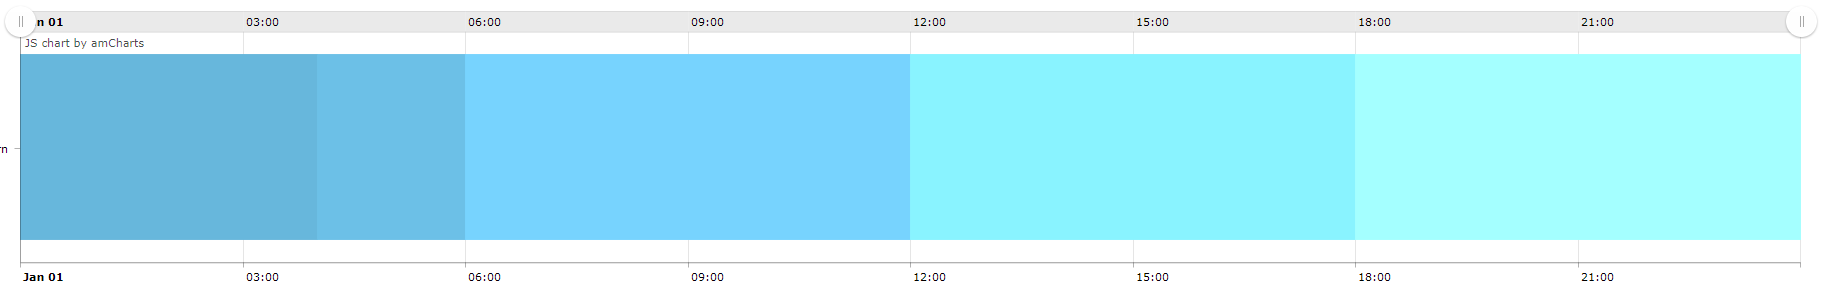
In this example, I don’t want the Jan 01 showing, since my data doesn’t have date it’s just a bogus date.
Thanks,
gorelov
January 18, 2019, 7:10am
#3
Hi,
Unfortunately, there is no way to remove a day label from value/category axis, it’s handled by amCharts. Jan 01 won’t be displayed in case the first value greater than 00:00.
Regards,
Thanks for your reply Gleb.
ref: https://codepen.io/team/amcharts/pen/2d1ae34d17896885874766cd6fc9da49
Thanks,
gorelov
January 21, 2019, 7:37am
#6
Sure, take a look at the example:
<?xml version="1.0" encoding="UTF-8" standalone="no"?>
<window xmlns="http://schemas.haulmont.com/cuba/window.xsd"
        caption="msg://caption"
        class="com.company.demo.web.screens.Screen"
        messagesPack="com.company.demo.web.screens"
        xmlns:chart="http://schemas.haulmont.com/charts/charts.xsd">
    <dialogMode height="600"
                width="800"/>
    <layout>
        <chart:ganttChart id="ganttChart"
                          marginRight="70"
                          dataDateFormat="YYYY-MM-DD"
                          columnWidth="0.5"
                          rotate="false"
                          categoryField="category"
                          segmentsField="segments"
                          colorField="color"
                          startField="start"
                          endField="end"
                          durationField="duration"
                          height="100%"
                          width="100%">
            <chart:valueAxis maximum="24"
                             gridCount="12"
                             autoGridCount="false"
                             title="Hours">
                <chart:labelFunction>
                    <![CDATA[
                        function(value) {
                          value = Math.round(value);
                          if (value > 12) {
                            return value - 12 + " PM";
                          } else if (value == 12) {
                            return value + " PM";
                          } else if (value == 0) {
                            return "0 AM";
                          }
                          return value + "AM";
                        }
                    ]]>
                </chart:labelFunction>
            </chart:valueAxis>
            <chart:graph fillAlphas="1"
                         lineAlpha="1"
                         lineColor="WHITE"/>
            <chart:categoryAxis parseDates="true"
                                title="Days"/>
            <chart:valueScrollbar autoGridCount="true"/>
            <chart:chartCursor cursorColor="#55bb76"
                               valueBalloonsEnabled="false"
                               cursorAlpha="0"
                               valueLineAlpha="0.5"
                               valueLineBalloonEnabled="true"
                               zoomable="false"
                               valueZoomable="true"/>
            <chart:legend position="TOP">
                <chart:data>
                    <chart:item title="Normal"
                                color="#249948"/>
                    <chart:item title="Alert"
                                color="#e10b0b"/>
                </chart:data>
            </chart:legend>

            <chart:data>
                <chart:item>
                    <chart:property name="category" value="2017-01-10" type="date"/>
                    <chart:property name="segments">
                        <chart:item>
                            <chart:property name="start" value="0"/>
                            <chart:property name="end" value="24"/>
                            <chart:property name="color" value="#249948"/>
                        </chart:item>
                        <chart:item>
                            <chart:property name="start" value="11.5"/>
                            <chart:property name="end" value="12"/>
                            <chart:property name="color" value="#e10b0b"/>
                        </chart:item>
                        <chart:item>
                            <chart:property name="start" value="20"/>
                            <chart:property name="end" value="22"/>
                            <chart:property name="color" value="#e10b0b"/>
                        </chart:item>
                    </chart:property>
                </chart:item>

                <chart:item>
                    <chart:property name="category" value="2017-01-11" type="date"/>
                    <chart:property name="segments">
                        <chart:item>
                            <chart:property name="start" value="0"/>
                            <chart:property name="end" value="24"/>
                            <chart:property name="color" value="#249948"/>
                        </chart:item>
                        <chart:item>
                            <chart:property name="start" value="5"/>
                            <chart:property name="end" value="7"/>
                            <chart:property name="color" value="#e10b0b"/>
                        </chart:item>
                        <chart:item>
                            <chart:property name="start" value="11"/>
                            <chart:property name="end" value="12.9"/>
                            <chart:property name="color" value="#e10b0b"/>
                        </chart:item>
                        <chart:item>
                            <chart:property name="start" value="17"/>
                            <chart:property name="end" value="17.3"/>
                            <chart:property name="color" value="#e10b0b"/>
                        </chart:item>
                    </chart:property>
                </chart:item>
            </chart:data>

        </chart:ganttChart>
    </layout>
</window>
1 Like
Excellent!! it fixed my issue. Thank you!