Hello, I would like to propose two ideas to complete a magnificent component as is the table:
1- In Group and Tree table when using column aggregators you can access the value of the aggregations by each group and make calculations with them to be able to show these calculations in the same row as the aggregations.
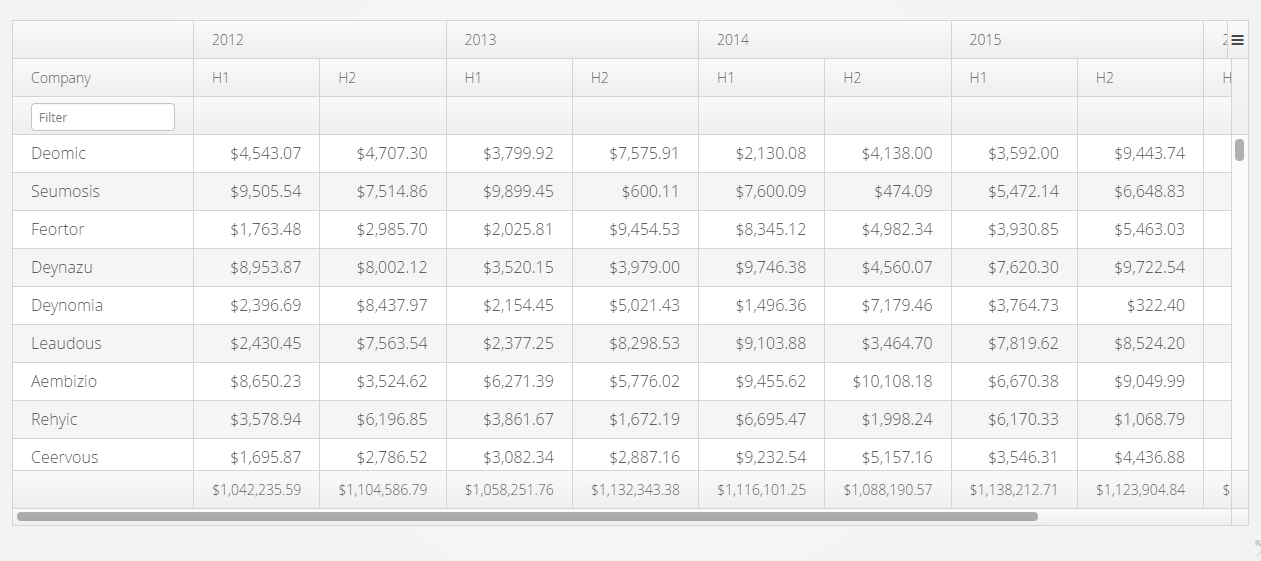
2.- Use a table with the functions of a pivot table (attached image), it is true that there is a chart component called pivot table but I have not figured out how to have different hierarchical levels in the columns. In a pivot table I can have rows, columns and measures with different levels of hierarchies for rows and columns and added calculation functions for the different hierarchies in rows and columns.
Greetings.
We will think how this can be implemented. I’ve created the issue. Thank you for your idea.
Also, we will appreciate if you share your ideas what API or abilities would be helpful for you.
The provided image displays Vaadin Grid component instead of table and we have the implementation of this component - DataGrid. You can see the example of header and footer configuration in our Sampler app.
Regards,
Gleb
Hi Gleb, thanks for the reply. We believe that the “core” component of a company framework is the Grid, all the capabilities that can be implemented in this component will be a differential factor with respect to other frameworks. Besides the improvement commented in the question that initiates the thread would also be interesting to be able to introduce formulas that make calculations on columns by the user of the application, without having to be predefined by the programmer.
I think that one way to enrich the component is to have functionalities of a pivot table and an olap viewer with formulas that can be applied between different levels of hierarchies, with the advantage of not having to depend on a third product, without having to generate cubes, Only jpql or sql queries.
Greetings.