Chart.js is open source (MIT license) project for data visualization. It draws charts on the canvas and supports 8 different chart types such as Pie, Bar, Radar, Scatter, etc. Chart.js has simple API and provides a lot of features: responsive charts, click events, animations, updating data and others.
In this tutorial, we will use Vaadin Chart.js Add-on. It provides simple fluent API for creating charts from Java code.
We will use CUBA Platform 7.0.5 and Studio v9.1.
Vaadin add-on dependency
Add add-on dependency to webModule in the build.gradle file (how to add a third-party vaadin component):
configure(webModule) {
    configurations {
        ...
    }

    dependencies {
        compileOnly(servletApi)
        compile(globalModule)
        compile("com.byteowls:vaadin-chartjs:1.3.0")
    }
    ...
  }
Note, if you use bintray repository you need to add the following to your repositories list in build.gradle file:
maven {
    url 'http://maven.vaadin.com/vaadin-addons'
}
We skip adding of widgetset to our project because given add-on doesn’t use GWT code.
Donut Chart
- Add
VBoxLayoutthat will contain a Pie Chart. Layout will be:
<layout>
    <vbox id="chartContainer"/>
</layout>
- In order to create a Donut Chart we should define
DonutChartConfig. It contains all settings and data sets. Then it will be used inChartJsinstance. So configuration can be the following:
private ChartJs createDonutChart() {
   DonutChartConfig config = new DonutChartConfig();
   config
       .data()
           .labels("Red", "Green", "Yellow", "Grey", "Dark Grey")
           .addDataset(new PieDataset().label("Dataset 1"))
           .addDataset(new PieDataset().label("Dataset 2"))
           .addDataset(new PieDataset().label("Dataset 3"))
           .and();
   config
       .options()
           .responsive(true)
           .title()
               .display(true)
               .text("Chart.js Doughnut Chart")
               .and()
           .animation()
               .duration(1500)
               .animateScale(true)
               .animateRotate(true)
               .and()
           .done();

   generateData(config);

   ChartJs chart = new ChartJs(config);
   chart.setWidth("800px");
   return chart;
}
It contains three dataset and chart’s title and rotate animation are specified. Then we need to generate sample data.
private void generateData(DonutChartConfig config) {
        String[] colors = new String[]{"#F7464A", "#46BFBD", "#FDB45C", "#949FB1", "#4D5360"};

        List<String> labels = config.data().getLabels();
        for (Dataset<?, ?> ds : config.data().getDatasets()) {
            PieDataset lds = (PieDataset) ds;
            lds.backgroundColor(colors);

            List<Double> data = new ArrayList<>();
            for (int i = 0; i < labels.size(); i++) {
                data.add((double) (Math.round(Math.random() * 100)));
            }
            lds.dataAsList(data);
        }
    }
The label acts as a category and count of added data should equal to count of labels.
- Subscribe to
InitEventand add created chart to thechartContainer:
@Subscribe
private void onInit(InitEvent event) {
    chart = createPieChart();

    com.vaadin.ui.Layout layout = chartContainer.unwrap(com.vaadin.ui.Layout.class);
    layout.addComponent(chart);
}
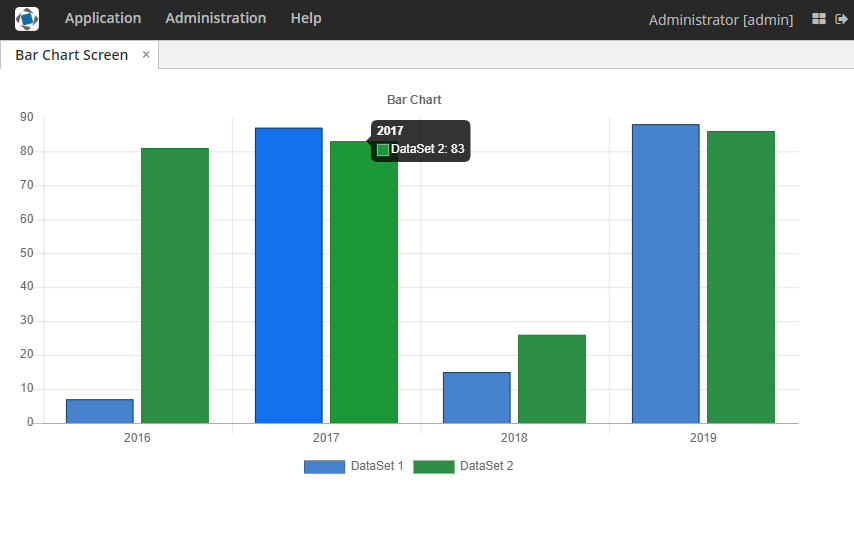
Bar Chart
We will create a Bar Chart in a similar way.
- The same step as in Pie Chart.
- For Bar Chart we will use
BarChartConfig.
private ChartJs createBarChart() {
    BarChartConfig barChartConfig = new BarChartConfig();
    barChartConfig
            .data()
                .addDataset(new BarDataset()
                                    .backgroundColor("#4282D3")
                                    .borderColor("#05326D")
                                    .borderWidth(1)
                                    .label("DataSet 1")
                                    .yAxisID("y-dataset1-id"))
                .addDataset(new BarDataset()
                                    .backgroundColor("#24913C")
                                    .borderColor("#007D1C")
                                    .borderWidth(1)
                                    .label("DataSet 2")
                                    .yAxisID("y-dataset1-id"))
                .and()
            .options()
                .title()
                    .display(true)
                    .text("Bar Chart")
                    .and()
                .scales()
                    .add(Axis.Y, new LinearScale()
                        .ticks()
                        .beginAtZero(true)
                        .and()
                        .display(true)
                        .position(Position.LEFT)
                        .id("y-dataset1-id"))
                    .and()
                .legend()
                    .position(Position.BOTTOM)
                    .and();

    generateData(barChartConfig);

    ChartJs chart = new ChartJs();
    chart.configure(barChartConfig);
    chart.setWidth("900px");
    return chart;
}
Each dataset can be bound to axis if axis id is defined. In our case, we bounded all datasets to one axis.
The method that generates sample data can be the following:
private void generateData(BarChartConfig config) {
   List<String> labels = new ArrayList<>(Arrays.asList("2016", "2017", "2018", "2019"));
   config.data().labelsAsList(labels);

   for (Dataset dataset : config.data().getDatasets()) {
       List<Double> values = new ArrayList<>(labels.size());
       for (int i = 0; i < labels.size(); i++) {
           values.add((double) (Math.round(Math.random() * 100)));
       }
       dataset.dataAsList(values);
   }
}
- The same step as in Pie Chart.
Useful resources
Vaadin add-on - here you can find link to demos.
chartjs.org - documentation and samples.
Demo project chartjs.zip (78.9 KB)